Spectrometer
The Spectrometer uses FFT (Fast Fourier Transform) techniques to display a frequency graph, providing a precise and detailed real-time frequency analysis.
-
To open the Spectrometer, select .
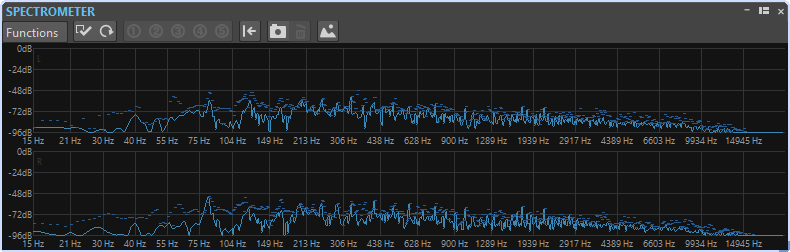
The current frequency spectrum is shown as a linear graph. Spectrum peaks are shown as short horizontal lines.