Spectrum Analyzer
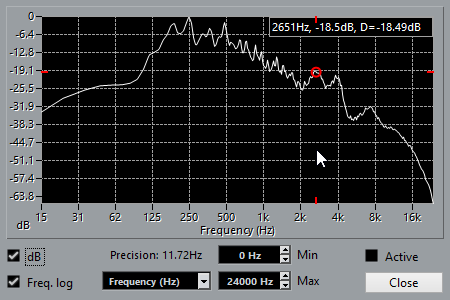
The Spectrum Analyzer analyzes the selected audio, computes the average spectrum, displays it in a two-dimensional graph, with frequency range on the x-axis and level distribution on the y-axis.
Spectrum Analyzer Settings
To open the Spectrum Analyzer, select .
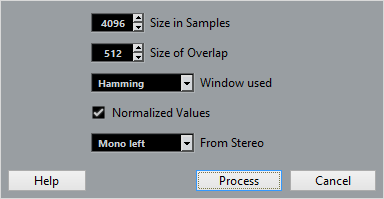
The Spectrum Analyzer shows the following settings:

- Size in Samples
Determines a size for the analysis blocks of the audio. The higher this value, the higher the frequency resolution of the resulting spectrum.
- Size of Overlap
Determines overlap between each analysis block.
- Window used
Selects which window type is used for the fast Fourier transform, the mathematical method used for computing the spectrum.
- Normalized Values
Activate this to scale the resulting level values, so that the highest level is displayed as 1 (0 dB).
- From Stereo
Specifies which channel is analyzed.
- Process
Analyzes the spectrum and opens the spectrum display.
Spectrum Display
The Spectrum Display shows the following settings:

- Frequency display
Allows you to compare the levels between frequencies. Move the pointer to one of the frequencies, right-click and move the pointer to the second frequency. The difference in level between the positions is displayed and labeled D in the upper right corner.
NoteFor stereo audio the display in the upper right corner shows the values for the left channel. To see the right channel values, hold down Shift.
- dB
Activate this option to show dB values on the vertical axis. Deactivate this option, to show values between 0 and 1.
- Freq. log
Activate this option to display the frequencies on the horizontal axis on a logarithmic scale. Deactivate this option, to show a linear frequency axis.
- Precision
Indicates the frequency resolution of the graph. This value is governed by the Size in Samples setting in the spectrum analyzer settings.
- Frequency/Note
Allows you to select if the frequencies are displayed in Hertz or with note names.
- Min.
Sets the lowest frequency shown in the graph.
- Max.
Sets the highest frequency shown in the graph.
- Active
Activate this option to open the next Spectrum Analysis dialog in the same window. Deactivate this option to show the next dialog in a separate window.