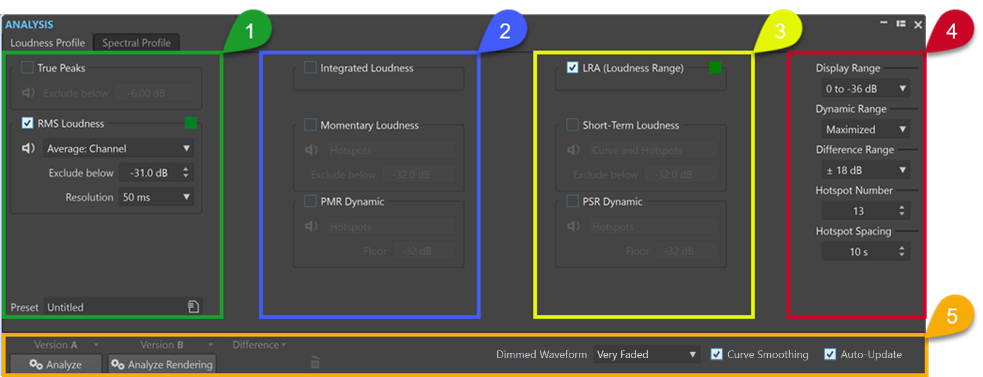
Loudness Profile Tab
The Loudness Profile tab allows you to set the parameters for the loudness-related Visual Analysis and to specify how to display the results.
-
To access the Loudness Profile tab, do one of the following:
-
Select .
-
Click the Analyze tab at the top of the Audio Editor or the Audio Montage window, and select Visual Analysis.
-

To establish a loudness profile, you can choose up to eight types of measurement for analyzing your audio and set parameters for them.
The following features are available for most or all of them:
-
The Play button
 (not available for Integrated Loudness and Loudness Range) exclusively plays all hotspots pertaining to the selected measurement type in a linear sequence. To enable you to clearly distinguish the hotspots from each other, one second of silence is automatically inserted prior to each of them. Furthermore, any preroll and postroll settings, as specified on the transport bar, are applied.Note
In the Audio Montage window, hotspot playback is limited to the active clip.
-
The Color button allows you to set a unique color for each measurement type, so that you can clearly identify it.
NoteThe Color button is only displayed when the corresponding measurement type is activated.
Column 1

- True Peaks
-
Detects and displays the true peaks per channel.
-
Exclude below allows you to define a threshold value, so that any true peak value below it is dismissed as a hotspot candidate.
-
- RMS Loudness
-
Measures the average power of an audio signal for each audio channel.
-
The Display menu to the right of the Play button allows you to choose from the following options:
-
Hotspots suppresses the display of curves and shows hotspots only.
-
Curve and Hotspots displays both curves and hotspots.
-
Balance Curve displays a curve that represents the balance between the two channels in a stereo file. For multichannel files, one curve per stereo cluster is generated.
-
Average: Channel displays a curve that represents the average loudness of each audio channel.
-
Average: Balance displays a curve that represents the average loudness balance between the channels.
-
-
Exclude below allows you to define a threshold value, so that any RMS value below it is dismissed as a hotspot candidate.
-
Resolution specifies the duration of the audio slices to be averaged.
Decreasing the value allows you to inspect your audio in more detail, as it reduces the size of the audio slices to be analyzed.
A high value allows you to evaluate the sound more broadly, as the size of the audio slices to be measured increases, according to your setting.
-
- Preset
-
Allows you to save and organize presets.
Column 2

- Integrated Loudness
-
-
Average displays a horizontal line that represents the average loudness of the entire audio file or clip.
With multiple clips selected in the Audio Montage window, this option provides visual feedback on the volume differences between the clips.
In the Audio Editor, it enables you to see the difference between the rendered state and the original state of an audio file.
-
Curve displays a curve that represents how the integrated loudness progresses over time, culminating in the average value.
-
Average and Curve displays both a horizontal line that represents the average loudness of the entire audio file or clip and a curve that represents how the integrated loudness progresses over time, culminating in the average value.
-
- Momentary Loudness
-
Measures the loudness with a resolution of 400 milliseconds, as specified in the EBU R128 standard. The rolling average value resulting from this is continuously updated every 100 milliseconds.
-
The Display menu to the right of the Play button allows you to choose from the following options:
-
Hotspots suppresses the display of curves and shows hotspots only.
-
Curve and Hotspots displays both curves and hotspots.
-
-
Exclude below allows you to define a threshold value, so that any momentary loudness value below it is dismissed as a hotspot candidate.
-
- PMR Dynamic (Peak to Momentary Loudness Ratio)
-
Captures and displays the difference between the peak level and the momentary loudness level; similar to PSR Dynamic, but for denser audio parts.
-
The Display menu to the right of the Play button allows you to choose from the following options:
-
Hotspots suppresses the display of curves and shows hotspots only.
-
Curve and Hotspots displays both curves and hotspots.
-
-
Floor allows you to define a threshold value, so that any momentary loudness value below it is dismissed as a hotspot candidate.
-
Column 3

- LRA (Loudness Range)
-
-
Average displays two horizontal lines, the top one representing the loudest part and the lower one the softest part within the loudness range.
-
Curve displays a curve that represents how the softest and the loudest parts in the audio material progress over time, culminating in their average values.
-
Average and Curve displays both two horizontal lines, the top one representing the loudest part and the lower one the softest part within the loudness range, and a curve that represents how the softest and the loudest parts in the audio material progress over time, culminating in their average values.
Displays two horizontal lines, the top one representing the loudest part and the lower one the softest part within the loudness range, in accordance with the R128 standard.
With multiple clips selected in the Audio Montage window, it provides a visual representation of the loudness range differences between the clips.
In the Audio Editor, it enables you to see the difference between the rendered state and the original state of an audio file at a glance.
-
- Short-Term Loudness
-
Measures the loudness with a resolution of three seconds, as specified in the EBU R128 standard. The rolling average value resulting from this is continuously updated every 100 milliseconds. The measurement takes all channels into account.
-
The Display menu to the right of the Play button allows you to choose from the following options:
-
Hotspots suppresses the display of curves and shows hotspots only.
-
Curve and Hotspots displays both curves and hotspots.
-
-
Exclude below allows you to define a threshold value, so that any short-term loudness value below it is dismissed as a hotspot candidate.
-
- PSR Dynamic (Peak to Short-Term Loudness Ratio)
-
Captures and displays the difference between the true peak level and the short-term loudness level.
PSR values allow you to evaluate the degree of compression of your audio material and to assess how much leeway you have left to apply further compression.
The PSR value is proportional to the dynamic range of your audio material. The lower the PSR value, the more compressed the audio material.
-
The Display menu to the right of the Play button allows you to choose from the following options:
-
Hotspots suppresses the display of curves and shows hotspots only.
-
Curve and Hotspots displays both curves and hotspots.
-
-
Floor allows you to define a threshold value, so that any short-term loudness value below it is dismissed as a hotspot candidate.
TipWe recommend that you set Floor to a high value to prevent the detection of PSR hotspots from minor peaks during quiet periods in your audio. This enables you to focus on the loudest parts of your audio material.
-
There are two types of curves:
-
Time-varying curves continuously trace the audio content, along the timeline.
They allow you to focus on specific parts of your audio with particular characteristics.
-
Horizontal lines represent average values, derived from the audio file or the selected clips as a whole.
Each of them represents an average value, derived from the audio file or the selected clips as a whole.
They are useful for comparing different loudness profiles of one audio file or clip (that is, Version A to Version B) or of different clips or audio files with each other.
TipThis is useful for identifying inconsistencies between titles/clips of an album.
Column 4

- Display Range
-
Serves as a vertical zooming tool for the curve types RMS Loudness, Short-term Loudness, and Momentary Loudness, and determines the decibel range of the vertical space.
TipIf you are primarily interested in the most significant variations, we recommend choosing a low value.
To view the entire range of loudness variations, select a higher value.
- Dynamic Range
-
Serves as a vertical zooming tool for the curve types PSR and PMR, and determines the relation between the range of the display and decibel values.
TipTo view the entire dynamic range of your audio material, we recommend choosing Maximized.
To establish fixed reference points for comparing different audio files or clips, select a specific value range.
- Difference Range
-
Serves as a vertical zooming tool for RMS Balance and any other Differential Curve.
It indicates the relation between the range of the display and the decibels below and above the axis. The lower the value, the more the display zooms in on the disparities.
- Hotspot Number
-
Limits the number of hotspots to be displayed and selects the highest ones only.
For example, setting the value to 1 results in exclusively displaying the loudest section. Setting the value to 2 displays the two loudest sections, and so on.
- Hotspot Spacing
-
Controls the distance between hotspots, to prevent them from being displayed too close to each other.
For example, setting the value to 1 s ensures that there is at least a one-second space between the hotspots.
TipMake sure you set the value low enough, so that the desired number of hotspots is displayed.
Lower Section

You can display the results of the analysis for Version A or for Version B or both of them at the same time.
Hotspots are displayed by default, whereas the visibility of curves depends on the selected analysis parameters.
-
Analyze initiates the analysis of the loudness attributes of the active, unprocessed audio file in the Audio Editor or the selected, unprocessed clips in the Audio Montage window.
As a result, a loudness profile is generated that is labeled as Version A.
Version A allows you to display loudness-related hotspots, values, and curves for unrendered audio files or clips.
-
Analyze Rendering starts the analysis with processing applied; that is, as if the audio file or clips were rendered, and generates a loudness profile labeled as Version B.
NoteFor audio files, the analysis is based on the Master Section plug-ins.
For clips in an audio montage, the analysis encompasses any processing, including clip effects, track effects, output effects, and the Master Section plug-ins.
As a consequence, the more plug-ins and effects you add, the more time it takes to complete the analysis.
-
Version B allows you to display loudness-related hotspots, values, and curves for rendered audio files or clips.
You can access further options by clicking the arrow in the lower right corner of the Version A and/or Version B buttons:

|

|
-
-
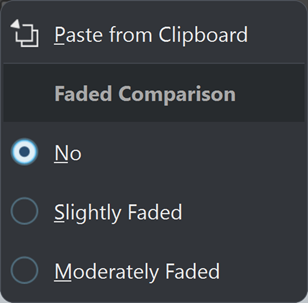
Copy to Clipboard for Version A and Paste from Clipboard for Version B allow you to save the analysis results, so that you can access and compare them with each other or with another audio file at a later point in time.
-
Faded Comparison
When comparing Version A to Version B, checking No prevents the curves for the selected version from being faded. However, fading the display for one version can make it easier to distinguish the curves for Version A and Version B from each other. Slightly Faded sets them to a minor level of transparency, while Moderately Faded further reduces the opacity of the curves for the selected version.
TipTo reduce the opacity of the waveform display, in addition to or instead of fading the curves, choose one of the options from the Dimmed Waveform menu.
-
-
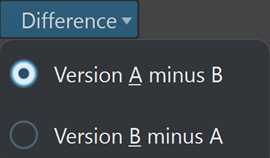
Difference displays a curve that represents the results of a comparison between Version A and Version B.

You can choose from the following options by clicking the arrow in the lower right corner of the Difference button:
-
Version A minus B subtracts the analysis results for Version B from Version A and displays the difference.
-
Version B minus A subtracts the analysis results for Version A from Version B and displays the difference.
-
-
In the Dimmed Waveform menu, when comparing Version A to Version B, checking No prevents the curves for the selected version from being faded. However, fading the display for one version can make it easier to distinguish the curves for Version A and Version B from each other. Slightly Faded sets them to a minor level of transparency, while Moderately Faded and Very Faded further reduce the opacity of the curves for the selected version.
-
Curve Smoothing displays smoother curves, which may, however, be slightly inaccurate, due to extrapolation and interpolation between quantized values.
Therefore, if precise values and accurate quantization of curves are your priority, we recommend that you deactivate this option.
-
With Auto-Update activated, WaveLab Pro automatically performs the analysis again, as soon as any audio files have been modified.
NoteIf this option is deactivated, loudness profiles are automatically deleted after modifying the audio material.
We recommend that you delete the analysis results as soon as you do not need the loudness profiles any more, as they consume a significant amount of memory. To do so, click the trash can button to the right of the Difference button.